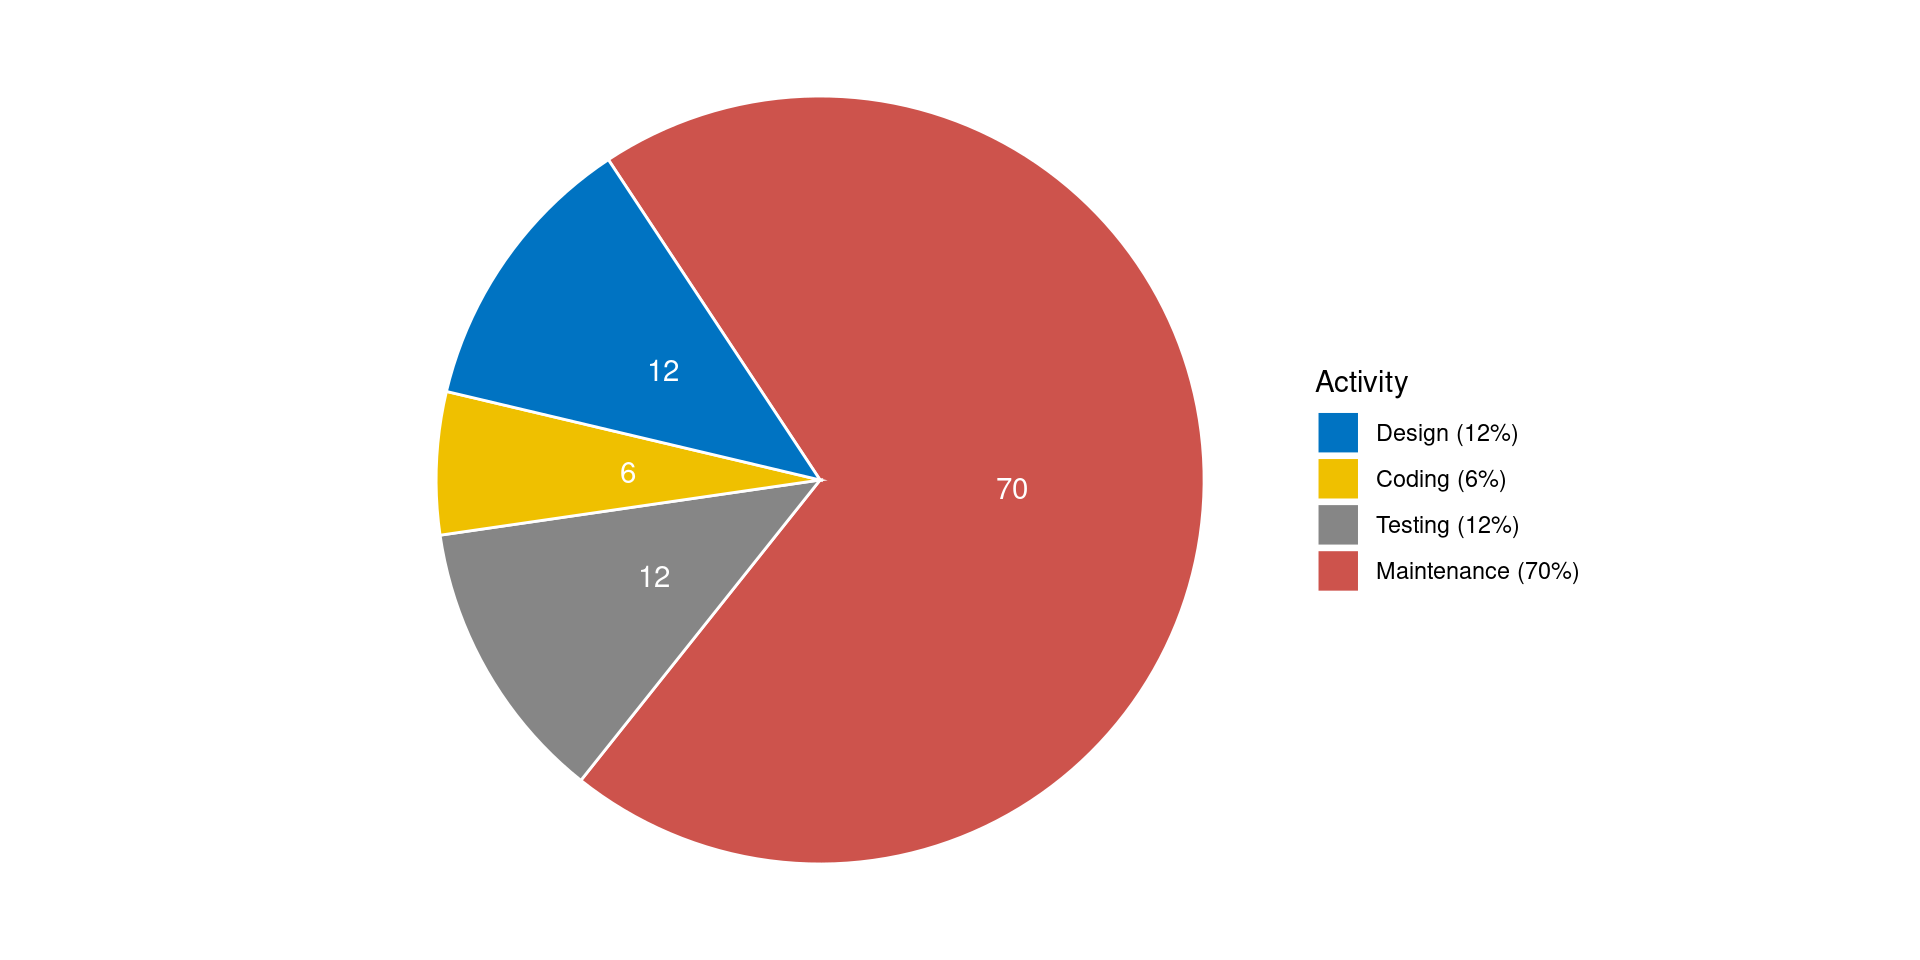
Cost distribution among software process activities
3 An R Package Engineering Workflow
Good Software Engineering Practice for R Packages
Joe
August 1, 2024
Motivation
From an idea to a production-grade R package
Example scenario: in your daily work, you notice that you need certain one-off scripts again and again.
The idea of creating an R package was born because you understood that “copy and paste” R scripts is inefficient and on top of that, you want to share your helpful R functions with colleagues and the world…
Professional Workflow
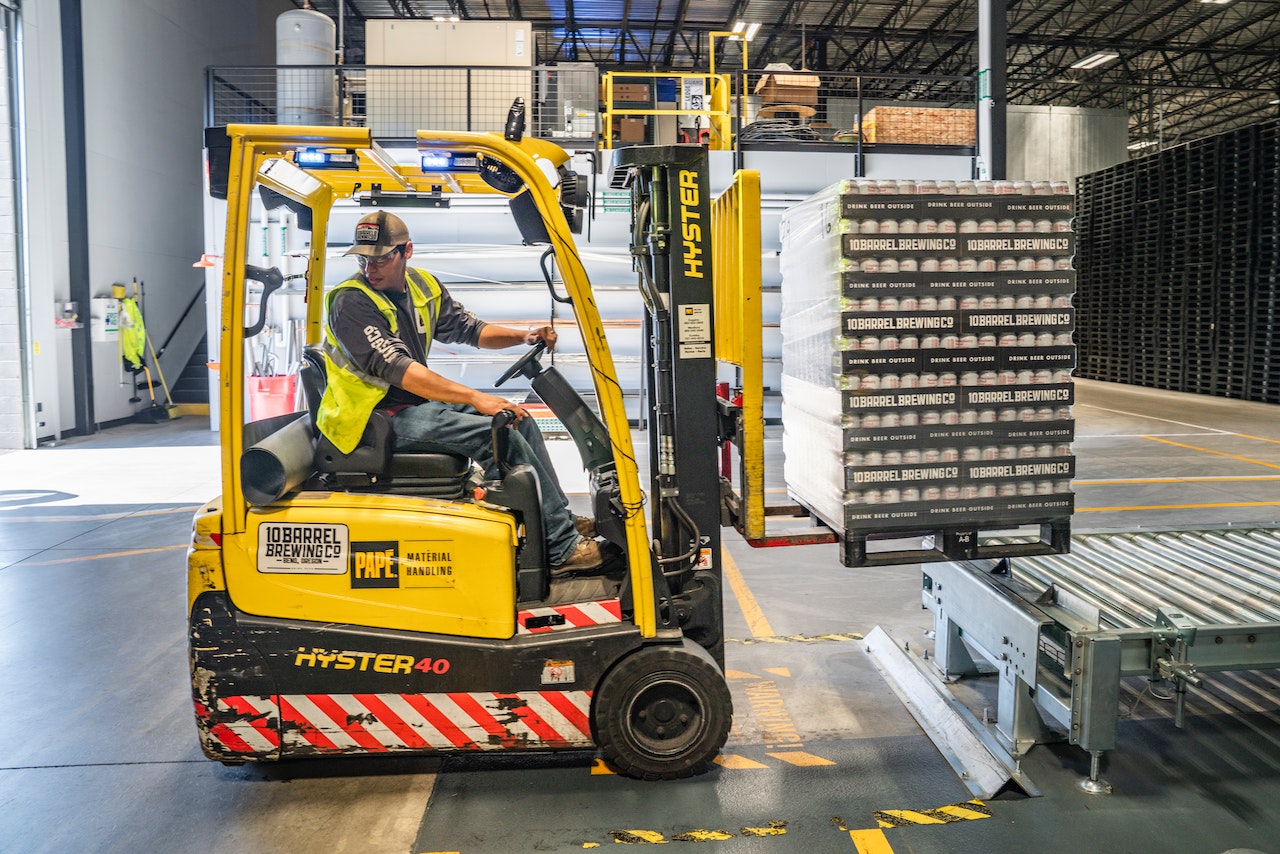
Photo CC0 by ELEVATE on pexels.com
Typical work steps
- Idea
- Concept creation
- Validation planning
- Specification:
- User Requirements Spec (URS),
- Functional Spec (FS), and
- Software Design Spec (SDS)
- R package programming
- Documented verification
- Completion of formal validation
- R package release
- Use in production
- Maintenance
Workflow in Practice

Photo CC0 by Chevanon Photography on pexels.com
Frequently Used Workflow in Practice
- Idea
- R package programming
- Use in production
- Bug fixing
- Use in production
- Bug fixing + Documentation
- Use in production
- Bug fixing + Further development
- Use in production
- Bug fixing + …
Bad practice!
Why?
Why practice good engineering?
Why practice good engineering?
Origin of errors in system development
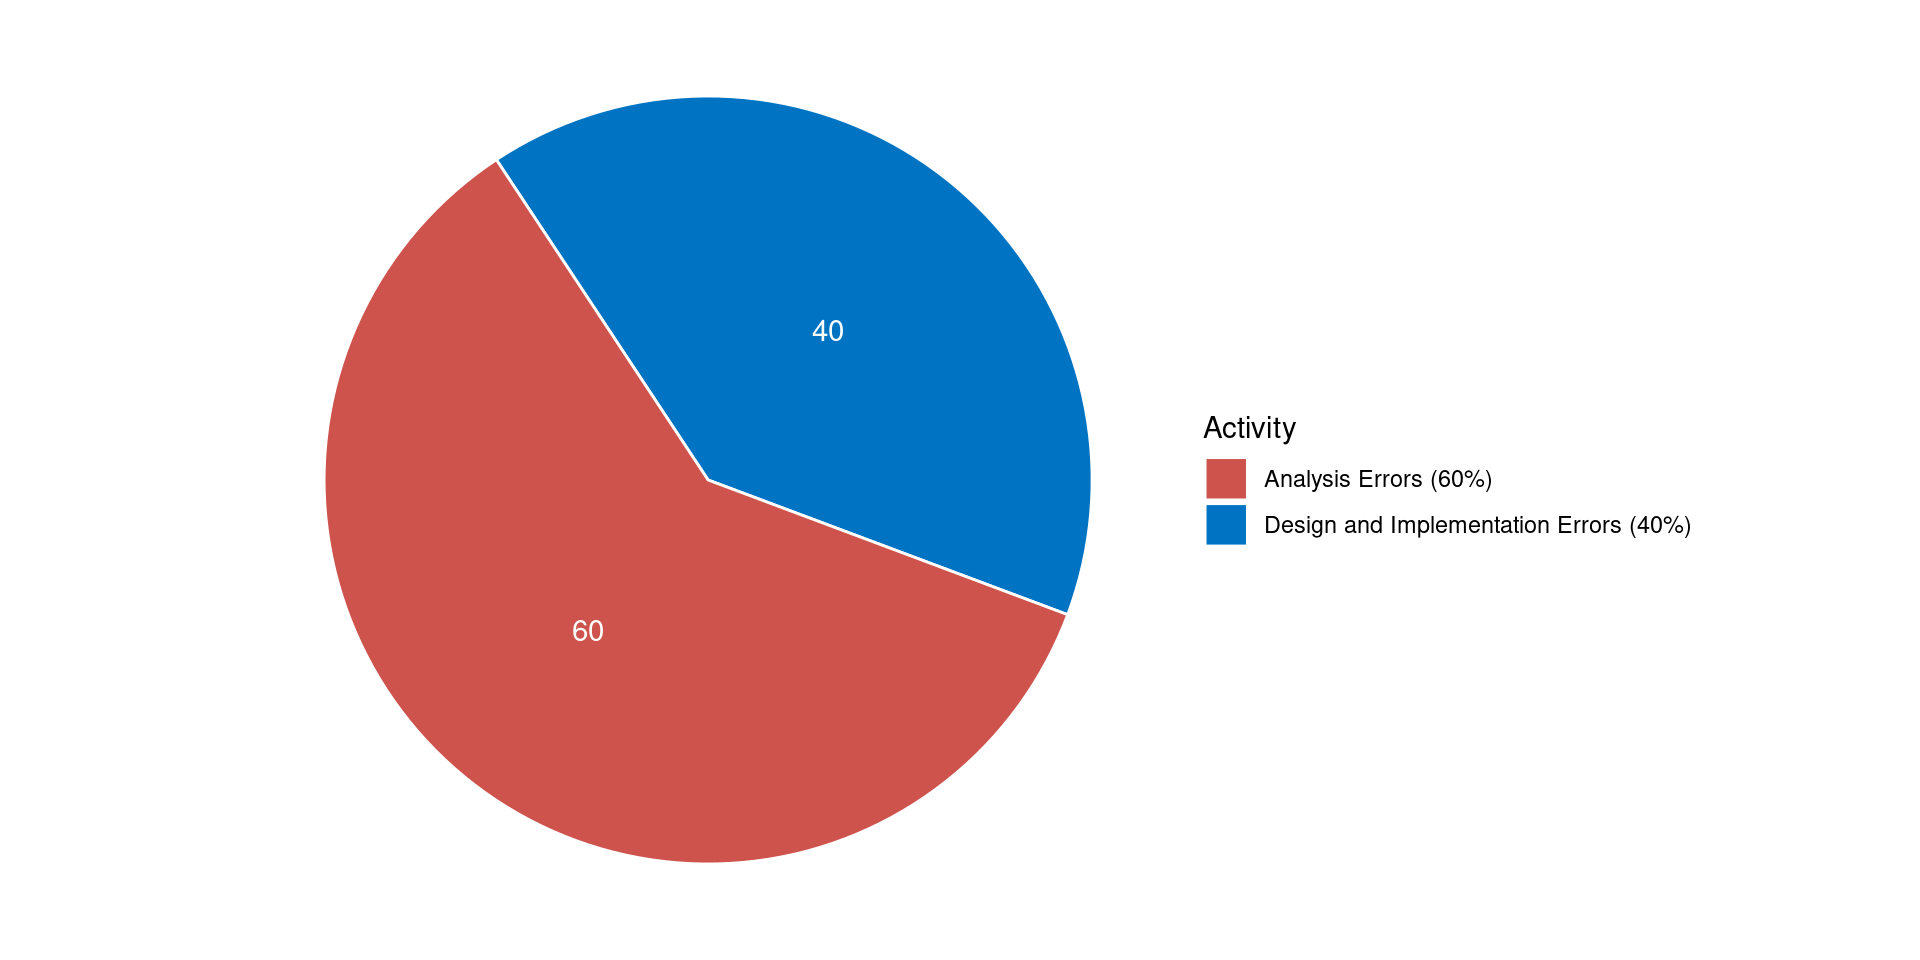
Boehm, B. (1981). Software Engineering Economics. Prentice Hall.
Why practice good engineering?
- Don’t waste time on maintenance
- Be faster with release on CRAN
- Don’t waste time with inefficient and buggy further development
- Fulfill regulatory requirements1
- Save refactoring time when the PoC becomes the release version
- You don’t have to be shy any longer about inviting other developers to contribute to the package on GitHub
Why practice good engineering?
Invest time in
- requirements analysis,
- software design, and
- architecture…
… but in many cases the workflow must be workable for a single developer or a small team.
Workable Workflow

Photo CC0 by Kateryna Babaieva on pexels.com
Suggestion for a Workable Workflow
- Idea
- Design docs
- R package programming
- Quality check (see Ensuring Quality by Joe)
- Use in production
Example - Step 1: Idea
Let’s assume that you used some lines of code to create simulated data in multiple projects:
Idea: put the code into a package
Example - Step 2: Design docs
- Describe the purpose and scope of the package
- Analyse and describe the requirements in clear and simple terms (“prose”)
| Obligation level | Key word1 | Description |
|---|---|---|
| Duty | shall | “must have” |
| Desire | should | “nice to have” |
| Intention | will | “optional” |
Example - Step 2: Design docs
Purpose and Scope
The R package simulatr shall enable the creation of reproducible fake data.
Package Requirements
simulatr shall provide a function to generate normal distributed random data for two independent groups. The function shall allow flexible definition of sample size per group, mean per group, standard deviation per group. The reproducibility of the simulated data shall be ensured via an optional seed It should be possible to print the function result. A graphical presentation of the simulated data will also be possible.
Example - Step 2: Design docs
Useful formats / tools for design docs:
- R Markdown1 (*.Rmd)
- Quarto1 (*.qmd)
- Overleaf2
- draw.io3
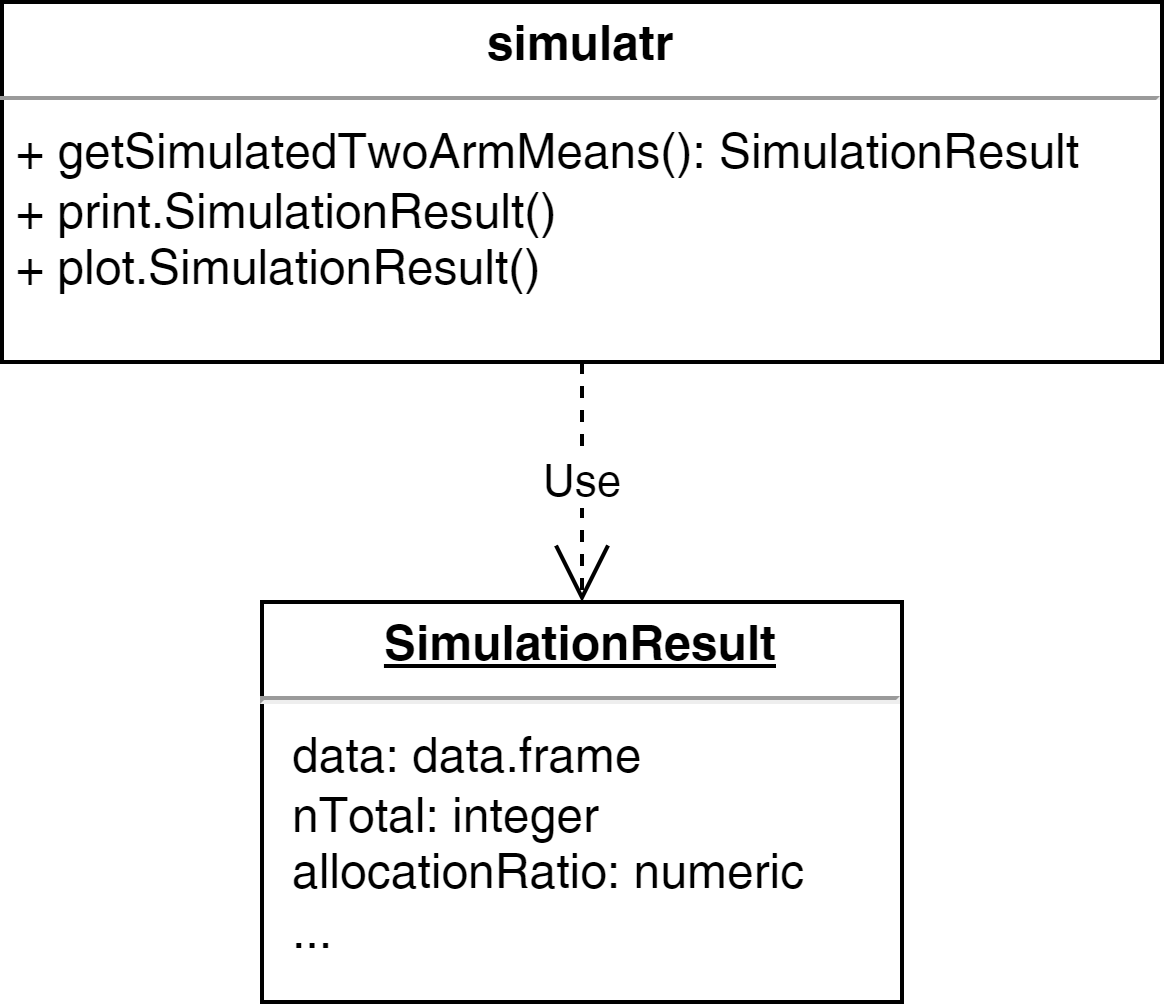
UML Diagram
Example - Step 3: Packaging
R package programming
- Create basic package project (see R Packages by Liming)
- C&P existing R scripts (one-off scripts, prototype functions) and refactor1 it if necessary
- Create R generic functions
- Document all functions
Example - Step 3: Packaging
One-off script as starting point:
Example - Step 3: Packaging
Refactored script:
Almost all functions, arguments, and objects should be self-explanatory due to their names.
Example - Step 3: Packaging
Define that the result is a list1 which is defined as class2:
getSimulatedTwoArmMeans <- function(n1, n2, mean1, mean2, sd1, sd2) {
    result <- list(n1 = n1, n2 = n2,
         mean1 = mean1, mean2 = mean2, sd1 = sd1, sd2 = sd2)
    result$data <- data.frame(
        group = c(rep(1, n1), rep(2, n2)),
        values = c(
            rnorm(n = n1, mean = mean1, sd = sd1),
            rnorm(n = n2, mean = mean2, sd = sd2)
        )
    )
    # set the class attribute
    result <- structure(result, class = "SimulationResult")
    return(result)
}Example - Step 3: Packaging
The output is impractical, e.g., we need to scroll down:
$n1
[1] 50

$n2
[1] 50

$mean1
[1] 5

$mean2
[1] 7

$sd1
[1] 3

$sd2
[1] 4

$data
    group     values
1       1  5.9251913
2       1  0.7408699
3       1  4.9995170
4       1  7.7109791
5       1  5.6630085
6       1  3.2387888
7       1  6.9006701
8       1  1.9915416
9       1  2.6548231
10      1  0.4100180
11      1  4.2266090
12      1  3.2620332
13      1  3.0735285
14      1  7.5280041
15      1 10.7394668
16      1 -1.9451583
17      1 -0.1755623
18      1  4.4861044
19      1  5.8988127
20      1  6.2186349
21      1  8.3628562
22      1  6.5530432
23      1  7.6091259
24      1  1.6520496
25      1  4.5141053
26      1  0.9559231
27      1  1.7751551
28      1  6.6780616
29      1  6.4732205
30      1  9.3658669
31      1  5.3885823
32      1  7.3190624
33      1  2.4663053
34      1  5.2890908
35      1  9.6866582
36      1  6.4434986
37      1  2.6570810
38      1  1.1917105
39      1 10.4731284
40      1  8.4537196
41      1  1.8042945
42      1  6.5951680
43      1  0.5610371
44      1  8.8319163
45      1  8.6229848
46      1  5.2747829
47      1  5.9887669
48      1  6.2578629
49      1  4.2776076
50      1  6.7086459
51      2  8.3392869
52      2 -1.5162979
53      2 12.9924506
54      2  9.0746058
55      2  5.8963864
56      2  4.8427300
57      2 10.7138230
58      2  7.2425504
59      2  9.1163721
60      2 -4.6590158
61      2  5.9284791
62      2  7.7651123
63      2  3.9271633
64      2  4.8667977
65      2  9.9553349
66      2  9.2491231
67      2 10.2893217
68      2  9.8586169
69      2  9.4470101
70      2  8.2881625
71      2  9.0817092
72      2 13.1257043
73      2  5.0361030
74      2  3.2025555
75      2  1.1415858
76      2 -1.1877397
77      2 11.9954985
78      2  9.2738717
79      2  7.8847395
80      2  4.5806220
81      2 12.4809898
82      2  3.2719664
83      2 15.6537567
84      2  5.7275283
85      2 16.7802997
86      2  8.5390734
87      2  5.9889145
88      2  3.9668118
89      2  6.6953507
90      2  8.6945281
91      2  6.1379639
92      2  1.2230658
93      2  4.1861670
94      2  2.9755123
95      2  6.1788318
96      2  5.6916052
97      2  9.6303248
98      2  2.3216218
99      2 12.9886628
100     2  9.1916946

attr(,"class")
[1] "SimulationResult"
Solution: implement generic function print
Example - Step 3: Packaging
Generic function print:
#' @title
#' Print Simulation Result
#'
#' @description
#' Generic function to print a `SimulationResult` object.
#'
#' @param x a \code{SimulationResult} object to print.
#' @param ... further arguments passed to or from other methods.
#'
#' @examples
#' x <- getSimulatedTwoArmMeans(n1 = 50, n2 = 50, mean1 = 5,
#'      mean2 = 7, sd1 = 3, sd2 = 4, seed = 123)
#' print(x)
#'
#' @export
$args
n1 n2 mean1 mean2 sd1 sd2
"50" "50" "5" "7" "3" "4"
$data
# A tibble: 100 × 2
group values
<dbl> <dbl>
1 1 5.93
2 1 0.741
3 1 5.00
4 1 7.71
5 1 5.66
6 1 3.24
7 1 6.90
8 1 1.99
9 1 2.65
10 1 0.410
# ℹ 90 more rowsWebsite with pkgdown
Setup of pkgdown
pkgdownmakes it quick and easy to build a website for your package- After installing
pkgdown, just useusethis::use_pkgdown()to get started - Main configuration happens in
_pkgdown.ymlfile - Many customizations can be applied, but main work during development is to keep the
referencesection updated with names of.Rdfiles
Example _pkgdown.yml file
---
url: https://openpharma.github.io/mmrm

template:
  bootstrap: 5
  params:
    ganalytics: UA-125641273-1

navbar:
  right:
    - icon: fa-github
      href: https://github.com/openpharma/mmrm

reference:
  - title: Package
    contents:
      - mmrm-package
  - title: Functions
    contents:
      - mmrm
      - fit_mmrm
      - mmrm_control
      - fit_single_optimizer
      - refit_multiple_optimizers
      - df_1d
      - df_md
      - component
Publication as GitHub Page
- It is helpful for users to read the website online
- GitHub is very helpful here because it allows
- A separate branch
gh-pagesthat stores the rendered website - GitHub actions automatically render the website when the
mainbranch is updated
- A separate branch
- To get started, use
usethis::use_pkgdown_github_pages()- Or, manually deploy site with
pkgdown::deploy_to_branch()
- Or, manually deploy site with
Exercise

Photo CC0 by Pixabay on pexels.com
Preparation
- Download the unfinished R package simulatr
- Extract the package zip file
- Open the project with RStudio
- Complete the tasks below
Tasks
Add assertions to improve the usability and user experience
Tip on assertions
Use the package checkmate to validate input arguments.
Example:
Error in playWithAssertions(-1) : Assertion on ‘n1’ failed: Element 1 is not >= 1.
Add three additional results:
- n total,
- creation time, and
- allocation ratio
Tip on creation time
Sys.time(), format(Sys.time(), '%B %d, %Y'), Sys.Date()
Add an additional result: t.test result
Add an optional alternative argument and pass it through t.test:
Implement the generic functions print and plot.
Tip on print
Use the plot example function from above and extend it.
Optional extra tasks:
Implement the generic functions
summaryandcatImplement the function
kableknown from the package knitr as generic. Tip: useto define kable as generic
Optional extra task1:
Document your functions with Roxygen2
- If you are already familiar with Roxygen2
References
- Gillespie, C., & Lovelace, R. (2017). Efficient R Programming: A Practical Guide to Smarter Programming. O’Reilly UK Ltd. [Book | Online]
- Grolemund, G. (2014). Hands-On Programming with R: Write Your Own Functions and Simulations (1. Aufl.).
O’Reilly and Associates. [Book | Online] - Rupp, C., & SOPHISTen, die. (2009). Requirements-Engineering und -Management: Professionelle, iterative Anforderungsanalyse für die Praxis (5. Ed.). Carl Hanser Verlag GmbH & Co. KG. [Book]
- Wickham, H. (2015). R Packages: Organize, Test, Document, and Share Your Code (1. Aufl.). O’Reilly and Associates. [Book | Online]
- Wickham, H. (2019). Advanced R, Second Edition.
Taylor & Francis Ltd. [Book | Online]
License information
- Creators (initial authors): Friedrich Pahlke
- In the current version, changes were done by (later authors): Joe Zhu
- This work is licensed under the Creative Commons Attribution-ShareAlike 4.0 International License.
- The source files are hosted at github.com/pharmarug/pharmasug2024-r-workshop, which is forked from the original version at github.com/openpharma/workshop-r-swe.
- Important: To use this work you must provide the name of the creators (initial authors), a link to the material, a link to the license, and indicate if changes were made