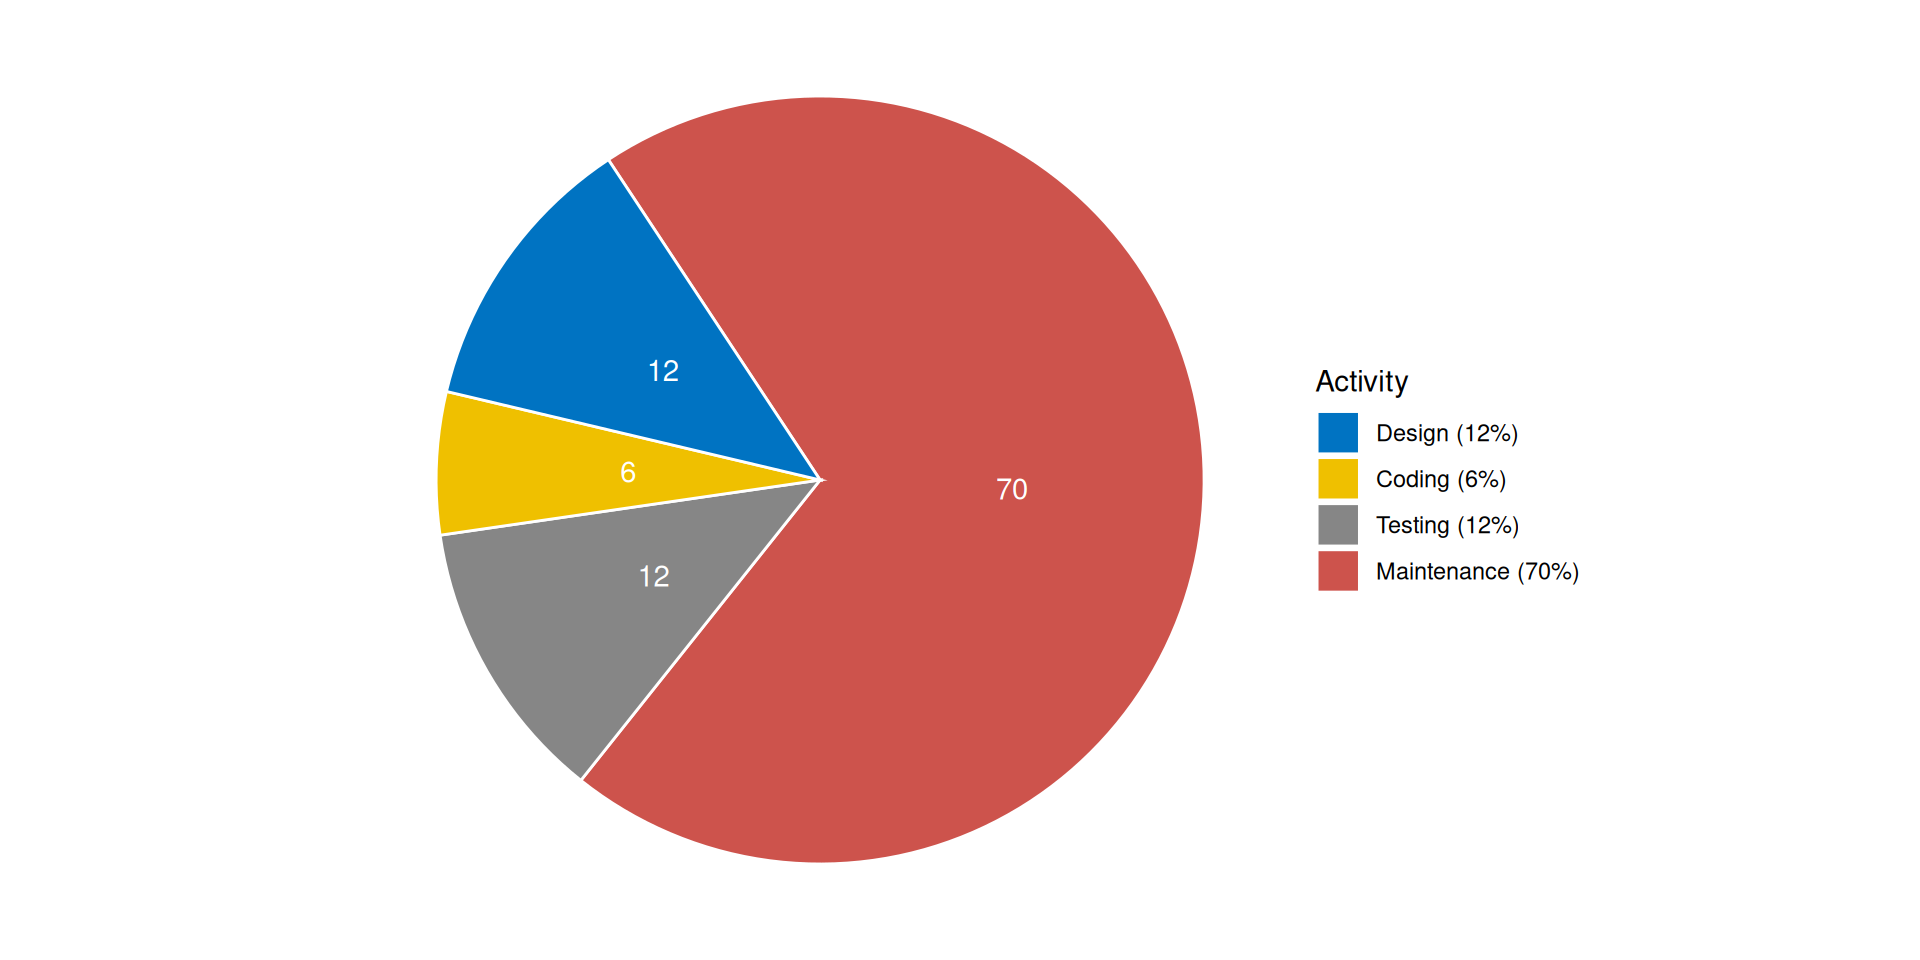
Cost distribution among software process activities
3 An R Package Engineering Workflow
Good Software Engineering Practice for R Packages
Zhenglin Ruan
July 31, 2026
Motivation
From an idea to a production-grade R package
Example scenario: in your daily work, you notice that you need certain one-off scripts again and again.
The idea of creating an R package was born because you understood that “copy and paste” R scripts is inefficient and on top of that, you want to share your helpful R functions with colleagues and the world…
Professional Workflow

Photo CC0 by ELEVATE on pexels.com
Typical work steps
- Idea
- Concept creation
- Validation planning
- Specification:
- User Requirements Spec (URS),
- Functional Spec (FS), and
- Software Design Spec (SDS)
- R package programming
- Documented verification
- Completion of formal validation
- R package release
- Use in production
- Maintenance
Workflow in Practice

Photo CC0 by Chevanon Photography on pexels.com
Frequently Used Workflow in Practice
- Idea
- R package programming
- Use in production
- Bug fixing
- Use in production
- Bug fixing + Documentation
- Use in production
- Bug fixing + Further development
- Use in production
- Bug fixing + …
Bad practice!
Why?
Why practice good engineering?
Why practice good engineering?
Origin of errors in system development
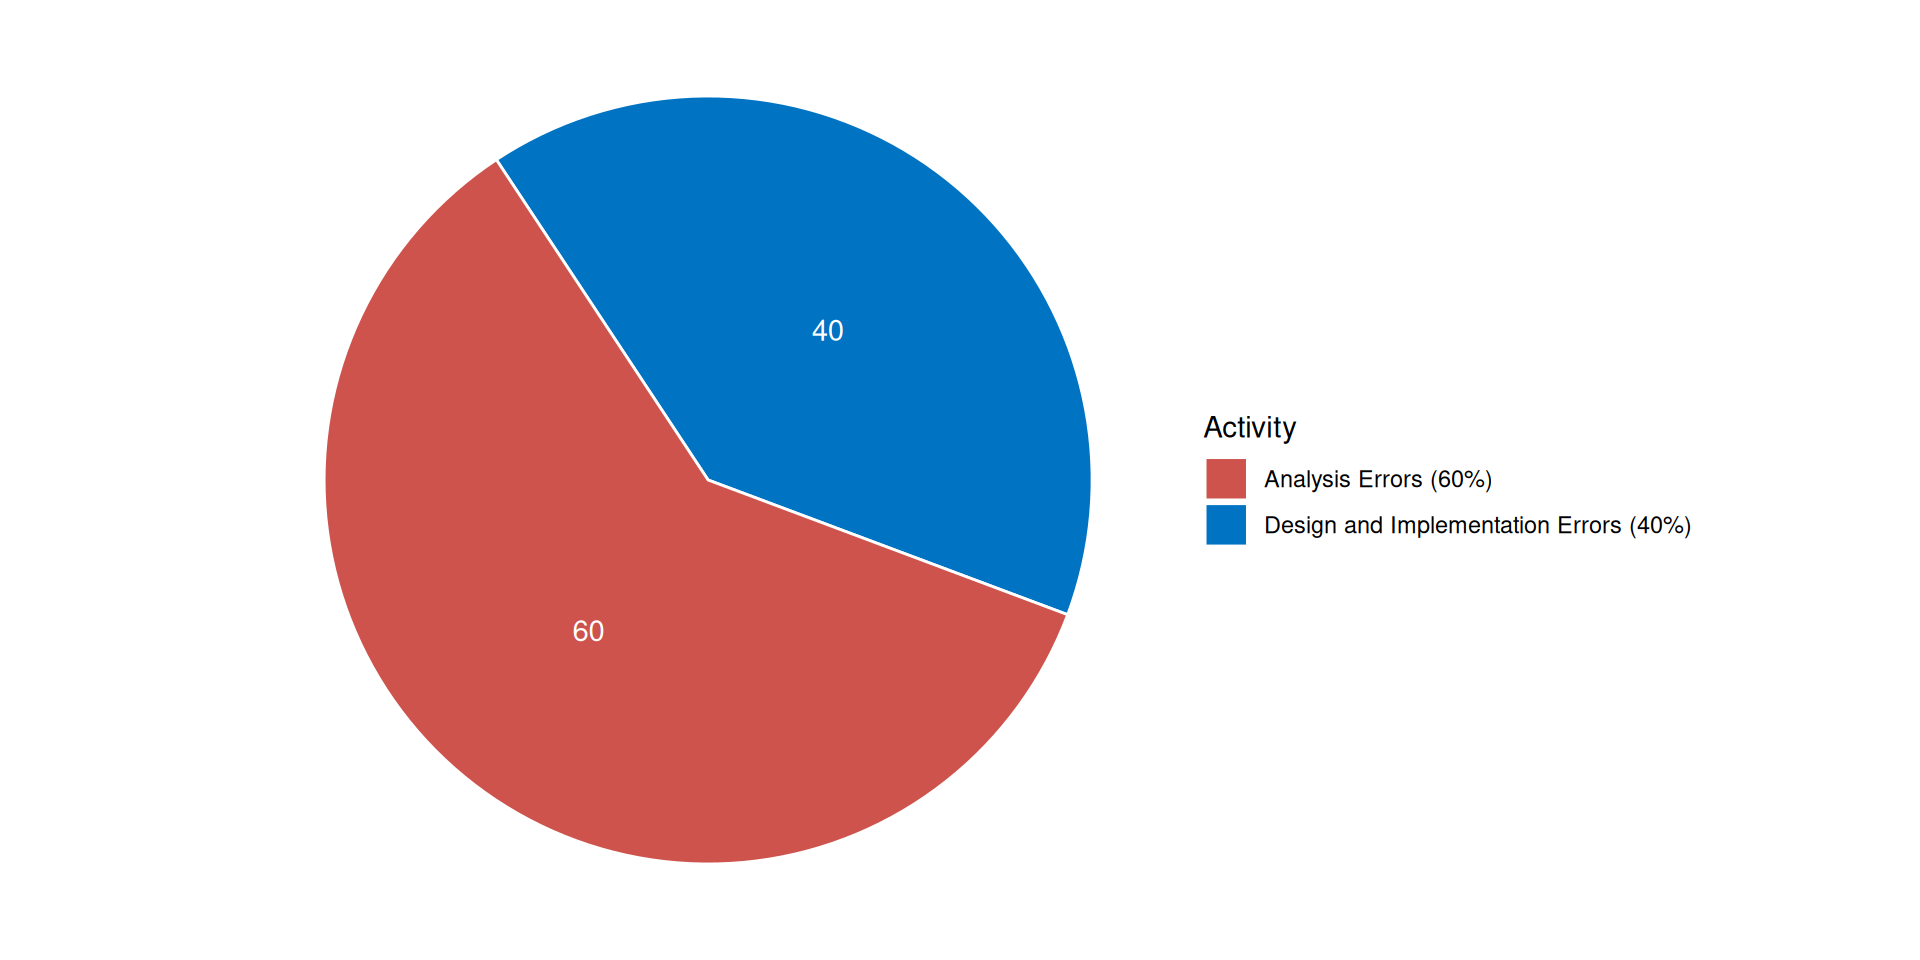
Boehm, B. (1981). Software Engineering Economics. Prentice Hall.
Why practice good engineering?
- Don’t waste time on maintenance
- Be faster with release on CRAN
- Don’t waste time with inefficient and buggy further development
- Fulfill regulatory requirements1
- Save refactoring time when the PoC becomes the release version
- You don’t have to be shy any longer about inviting other developers to contribute to the package on GitHub
Why practice good engineering?
Invest time in
- requirements analysis,
- software design, and
- architecture…
… but in many cases the workflow must be workable for a single developer or a small team.
Workable Workflow

Photo CC0 by Kateryna Babaieva on pexels.com
Suggestion for a Workable Workflow
- Idea
- Design docs
- R package programming
- Quality check (see Ensuring Quality by Chunyan)
- Use in production
Example - Step 1: Idea
Let’s assume that you used some lines of code to create simulated data in multiple projects:
Idea: put the code into a package
Example - Step 2: Design docs
- Describe the purpose and scope of the package
- Analyse and describe the requirements in clear and simple terms (“prose”)
| Obligation level | Key word1 | Description |
|---|---|---|
| Duty | shall | “must have” |
| Desire | should | “nice to have” |
| Intention | will | “optional” |
Example - Step 2: Design docs
Purpose and Scope
The R package simulatr shall enable the creation of reproducible fake data.
Package Requirements
simulatr shall provide a function to generate normal distributed random data for two independent groups. The function shall allow flexible definition of sample size per group, mean per group, standard deviation per group. The reproducibility of the simulated data shall be ensured via an optional seed It should be possible to print the function result. A graphical presentation of the simulated data will also be possible.
Example - Step 2: Design docs
Useful formats / tools for design docs:
- R Markdown1 (*.Rmd)
- Quarto1 (*.qmd)
- Overleaf2
- draw.io3
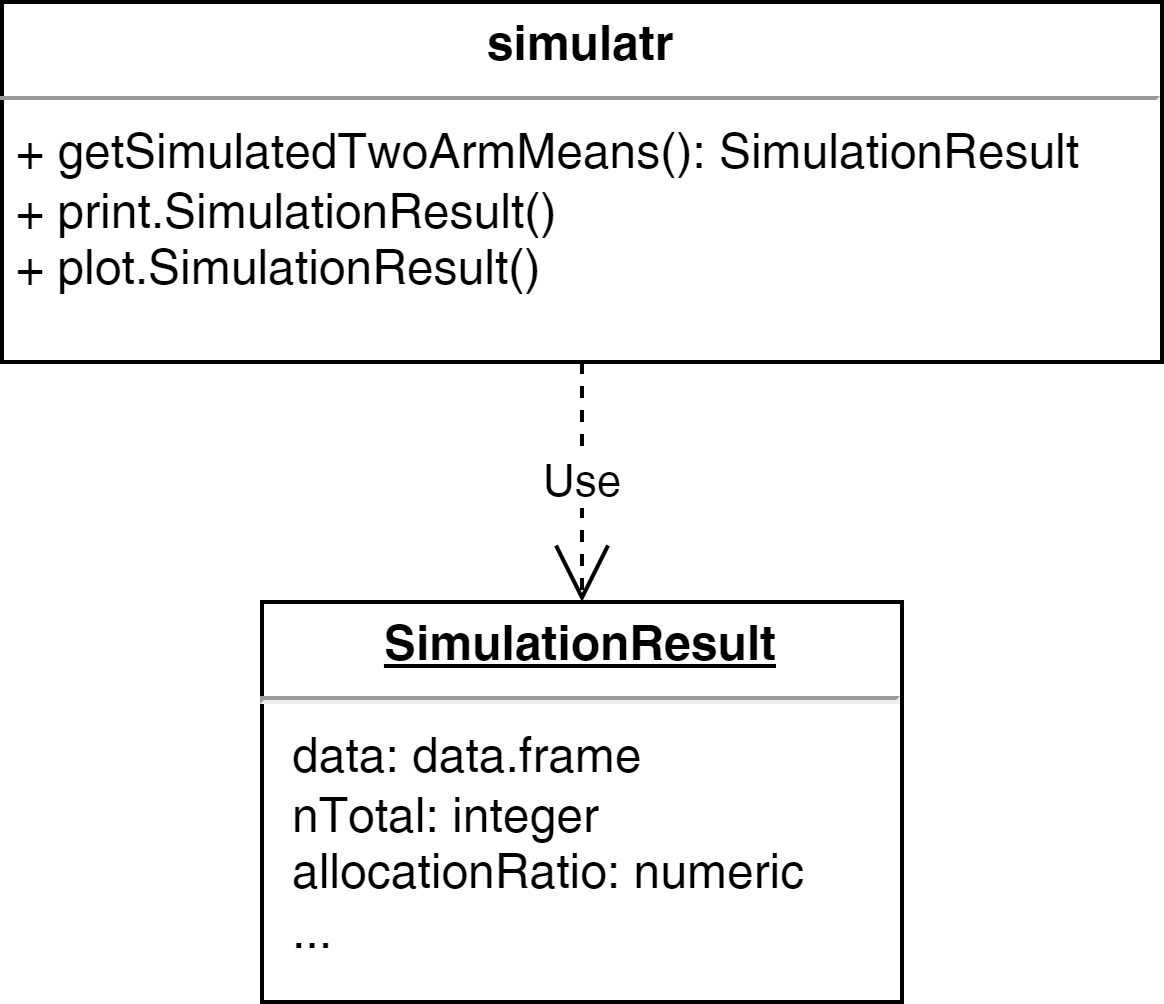
UML Diagram
Example - Step 3: Packaging
R package programming
- Create basic package project (see R Packages by Shuang)
- C&P existing R scripts (one-off scripts, prototype functions) and refactor1 it if necessary
- Create R generic functions
- Document all functions
Example - Step 3: Packaging
One-off script as starting point:
Example - Step 3: Packaging
Refactored script:
Almost all functions, arguments, and objects should be self-explanatory due to their names.
Example - Step 3: Packaging
Define that the result is a list1 which is defined as class2:
getSimulatedTwoArmMeans <- function(n1, n2, mean1, mean2, sd1, sd2) {
    result <- list(n1 = n1, n2 = n2,
         mean1 = mean1, mean2 = mean2, sd1 = sd1, sd2 = sd2)
    result$data <- data.frame(
        group = c(rep(1, n1), rep(2, n2)),
        values = c(
            rnorm(n = n1, mean = mean1, sd = sd1),
            rnorm(n = n2, mean = mean2, sd = sd2)
        )
    )
    # set the class attribute
    result <- structure(result, class = "SimulationResult")
    return(result)
}Example - Step 3: Packaging
The output is impractical, e.g., we need to scroll down:
$n1
[1] 50

$n2
[1] 50

$mean1
[1] 5

$mean2
[1] 7

$sd1
[1] 3

$sd2
[1] 4

$data
    group      values
1       1  2.67097969
2       1  3.08191437
3       1  3.43809857
4       1  5.08084966
5       1  3.39411235
6       1  2.98488742
7       1  3.17379331
8       1  9.74451101
9       1  2.46840043
10      1  3.92970234
11      1  4.11861806
12      1  3.39543940
13      1  4.48505188
14      1  3.96343529
15      1  4.30835196
16      1  5.30805364
17      1  2.75095531
18      1 11.18516938
19      1  5.40583509
20      1  7.14073222
21      1  2.94824342
22      1  8.23078683
23      1  4.74038481
24      1  9.45565419
25      1  4.83371368
26      1 10.54637974
27      1  5.17429900
28      1  6.30308380
29      1  9.42780819
30      1 -2.44482304
31      1  7.94008765
32      1  8.30485593
33      1  5.88236741
34      1  5.91281095
35      1  1.32082648
36      1  0.49572158
37      1  3.95539011
38      1  4.94166595
39      1  4.38036321
40      1  5.12010984
41      1  2.21676826
42      1  3.61517605
43      1  3.24707450
44      1  8.13989233
45      1  4.91111258
46      1  7.47317686
47      1  3.21570001
48      1  8.22253779
49      1 -2.27564972
50      1  1.12910271
51      2  8.28911539
52      2  4.89791078
53      2 10.76144960
54      2 10.33233775
55      2 10.13091673
56      2  9.32033554
57      2  5.44414846
58      2 11.56847194
59      2  5.85361278
60      2  7.55257397
61      2 11.61079590
62      2  7.55687112
63      2  3.45806576
64      2  8.52697554
65      2  9.31208723
66      2  8.32159771
67      2 13.23341199
68      2  5.59356043
69      2 11.58933461
70      2 -0.02044782
71      2  5.18042757
72      2  5.12065087
73      2  3.61148224
74      2  7.70445748
75      2 14.61239146
76      2  5.12093081
77      2 13.90363095
78      2  3.48759521
79      2  5.81819015
80      2  4.19004699
81      2  7.20405608
82      2  5.33613434
83      2  2.61447238
84      2  3.97530427
85      2 -0.60928425
86      2  5.51292564
87      2  4.49291953
88      2  7.85662611
89      2 10.96087308
90      2  7.27634239
91      2  3.38248536
92      2 -1.32552015
93      2  5.39766176
94      2  3.00484938
95      2  5.42412513
96      2  0.46036977
97      2  6.18520288
98      2  5.48555762
99      2  5.42891932
100     2  3.33045367

attr(,"class")
[1] "SimulationResult"
Solution: implement generic function print
Example - Step 3: Packaging
Generic function print:
#' @title
#' Print Simulation Result
#'
#' @description
#' Generic function to print a `SimulationResult` object.
#'
#' @param x a \code{SimulationResult} object to print.
#' @param ... further arguments passed to or from other methods.
#'
#' @examples
#' x <- getSimulatedTwoArmMeans(n1 = 50, n2 = 50, mean1 = 5,
#'      mean2 = 7, sd1 = 3, sd2 = 4, seed = 123)
#' print(x)
#'
#' @export
$args
n1 n2 mean1 mean2 sd1 sd2
"50" "50" "5" "7" "3" "4"
$data
# A tibble: 100 × 2
group values
<dbl> <dbl>
1 1 2.67
2 1 3.08
3 1 3.44
4 1 5.08
5 1 3.39
6 1 2.98
7 1 3.17
8 1 9.74
9 1 2.47
10 1 3.93
# ℹ 90 more rowsWebsite with pkgdown
Setup of pkgdown
pkgdownmakes it quick and easy to build a website for your package- After installing
pkgdown, just useusethis::use_pkgdown()to get started - Main configuration happens in
_pkgdown.ymlfile - Many customizations can be applied, but main work during development is to keep the
referencesection updated with names of.Rdfiles
Example _pkgdown.yml file
---
url: https://openpharma.github.io/mmrm

template:
  bootstrap: 5
  params:
    ganalytics: UA-125641273-1

navbar:
  right:
    - icon: fa-github
      href: https://github.com/openpharma/mmrm

reference:
  - title: Package
    contents:
      - mmrm-package
  - title: Functions
    contents:
      - mmrm
      - fit_mmrm
      - mmrm_control
      - fit_single_optimizer
      - refit_multiple_optimizers
      - df_1d
      - df_md
      - component
Publication as GitHub Page
- It is helpful for users to read the website online
- GitHub is very helpful here because it allows
- A separate branch
gh-pagesthat stores the rendered website - GitHub actions automatically render the website when the
mainbranch is updated
- A separate branch
- To get started, use
usethis::use_pkgdown_github_pages()- Or, manually deploy site with
pkgdown::deploy_to_branch()
- Or, manually deploy site with
Exercise

Photo CC0 by Pixabay on pexels.com
Preparation
- Download the unfinished R package simulatr
- Extract the package zip file
- Open the project with RStudio
- Complete the tasks below
Tasks
Add assertions to improve the usability and user experience
Tip on assertions
Use the package checkmate to validate input arguments.
Example:
Error in playWithAssertions(-1) : Assertion on ‘n1’ failed: Element 1 is not >= 1.
Add three additional results:
- n total,
- creation time, and
- allocation ratio
Tip on creation time
Sys.time(), format(Sys.time(), '%B %d, %Y'), Sys.Date()
Add an additional result: t.test result
Add an optional alternative argument and pass it through t.test:
Implement the generic functions print and plot.
Tip on print
Use the plot example function from above and extend it.
Optional extra tasks:
Implement the generic functions
summaryandcatImplement the function
kableknown from the package knitr as generic. Tip: useto define kable as generic
Optional extra task1:
Document your functions with Roxygen2
- If you are already familiar with Roxygen2
References
- Gillespie, C., & Lovelace, R. (2017). Efficient R Programming: A Practical Guide to Smarter Programming. O’Reilly UK Ltd. [Book | Online]
- Grolemund, G. (2014). Hands-On Programming with R: Write Your Own Functions and Simulations (1. Aufl.).
O’Reilly and Associates. [Book | Online] - Rupp, C., & SOPHISTen, die. (2009). Requirements-Engineering und -Management: Professionelle, iterative Anforderungsanalyse für die Praxis (5. Ed.). Carl Hanser Verlag GmbH & Co. KG. [Book]
- Wickham, H. (2015). R Packages: Organize, Test, Document, and Share Your Code (1. Aufl.). O’Reilly and Associates. [Book | Online]
- Wickham, H. (2019). Advanced R, Second Edition.
Taylor & Francis Ltd. [Book | Online]
License information
- Creators (initial authors): Friedrich Pahlke
- In the current version, changes were done by (later authors): Joe Zhu
- This work is licensed under the Creative Commons Attribution-ShareAlike 4.0 International License.
- The source files are hosted at github.com/pharmarug/pharmasug2026-r-workshop, which is forked from the original version at github.com/openpharma/workshop-r-swe.
- Important: To use this work you must provide the name of the creators (initial authors), a link to the material, a link to the license, and indicate if changes were made