Cost distribution among software process activities
4 An R Package Engineering Workflow
Good Software Engineering Practice for R Packages
Wenyi Liu
July 23, 2026
Motivation
From an idea to a production-grade R package
Example scenario: in your daily work, you notice that you need certain one-off scripts again and again.
The idea of creating an R package was born because you understood that “copy and paste” R scripts is inefficient and on top of that, you want to share your helpful R functions with colleagues and the world…
Professional Workflow
Photo CC0 by ELEVATE on pexels.com
Typical work steps
- Idea
- Concept creation
- Validation planning
- Specification:
- User Requirements Spec (URS),
- Functional Spec (FS), and
- Software Design Spec (SDS)
- R package programming
- Documented verification
- Completion of formal validation
- R package release
- Use in production
- Maintenance
Workflow in Practice

Photo CC0 by Chevanon Photography on pexels.com
Frequently Used Workflow in Practice
- Idea
- R package programming
- Use in production
- Bug fixing
- Use in production
- Bug fixing + Documentation
- Use in production
- Bug fixing + Further development
- Use in production
- Bug fixing + …
Bad practice!
Why?
Why practice good engineering?
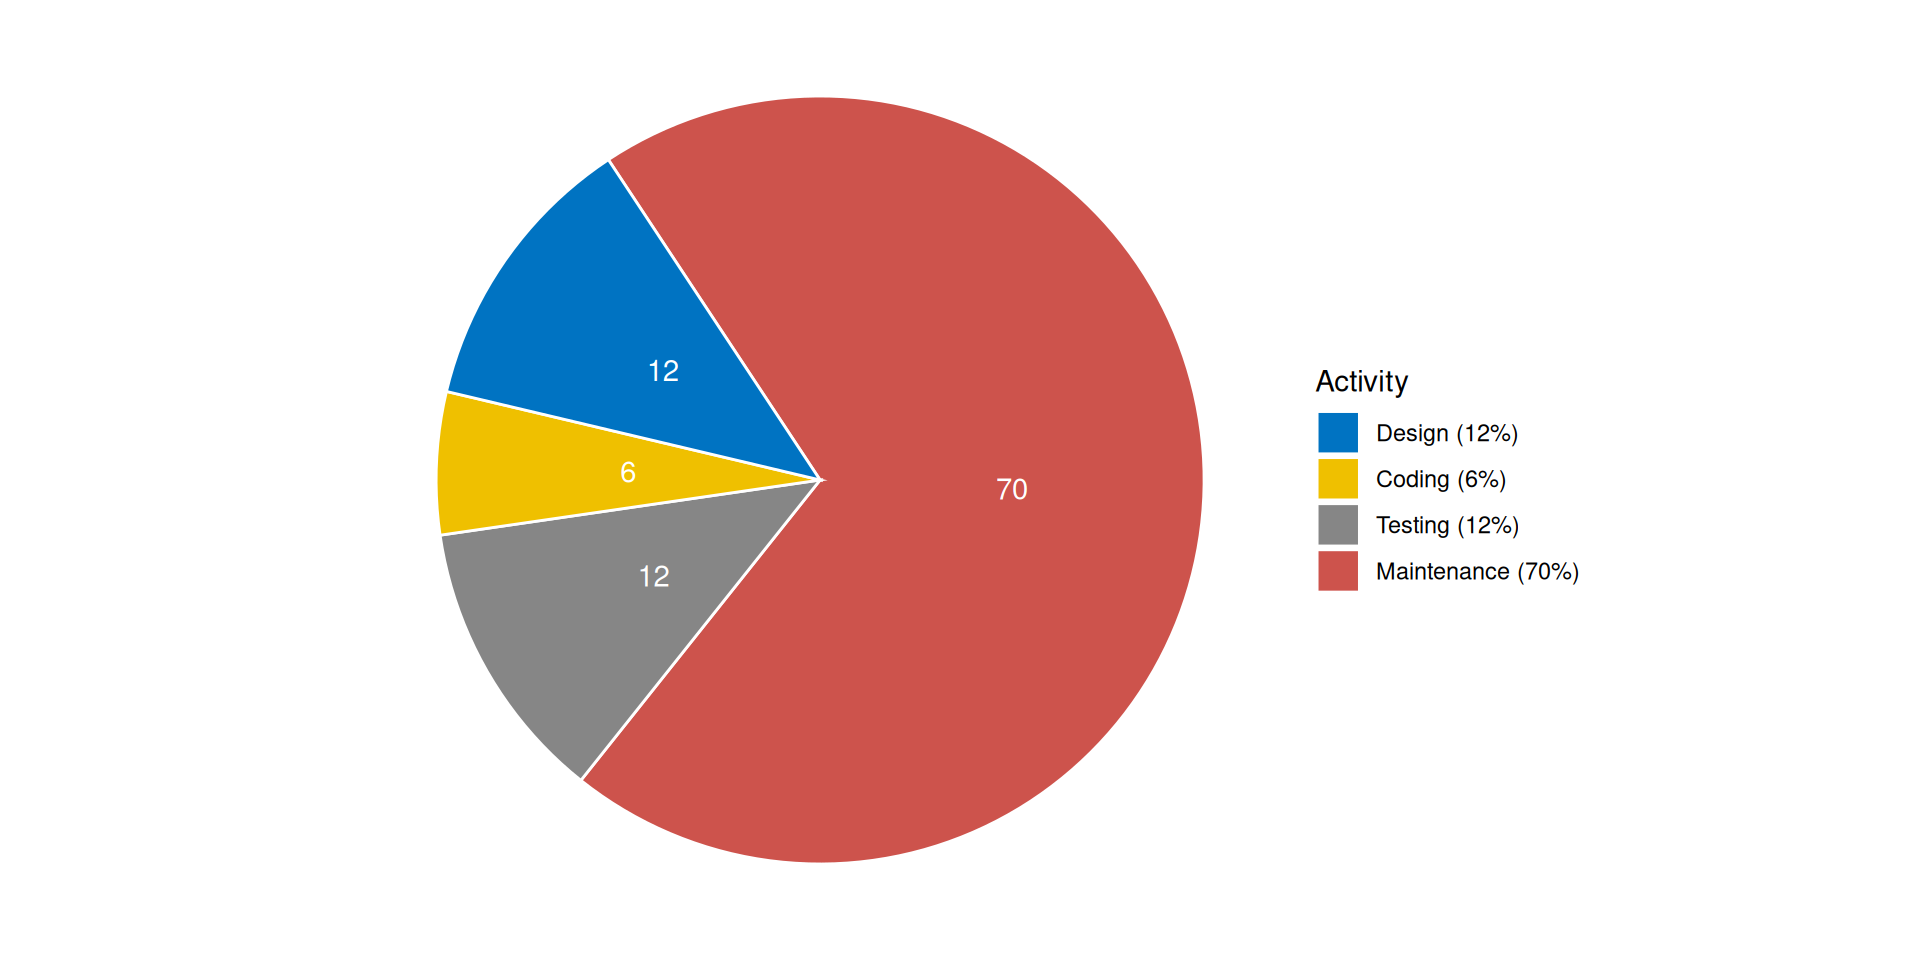
Why practice good engineering?
Origin of errors in system development
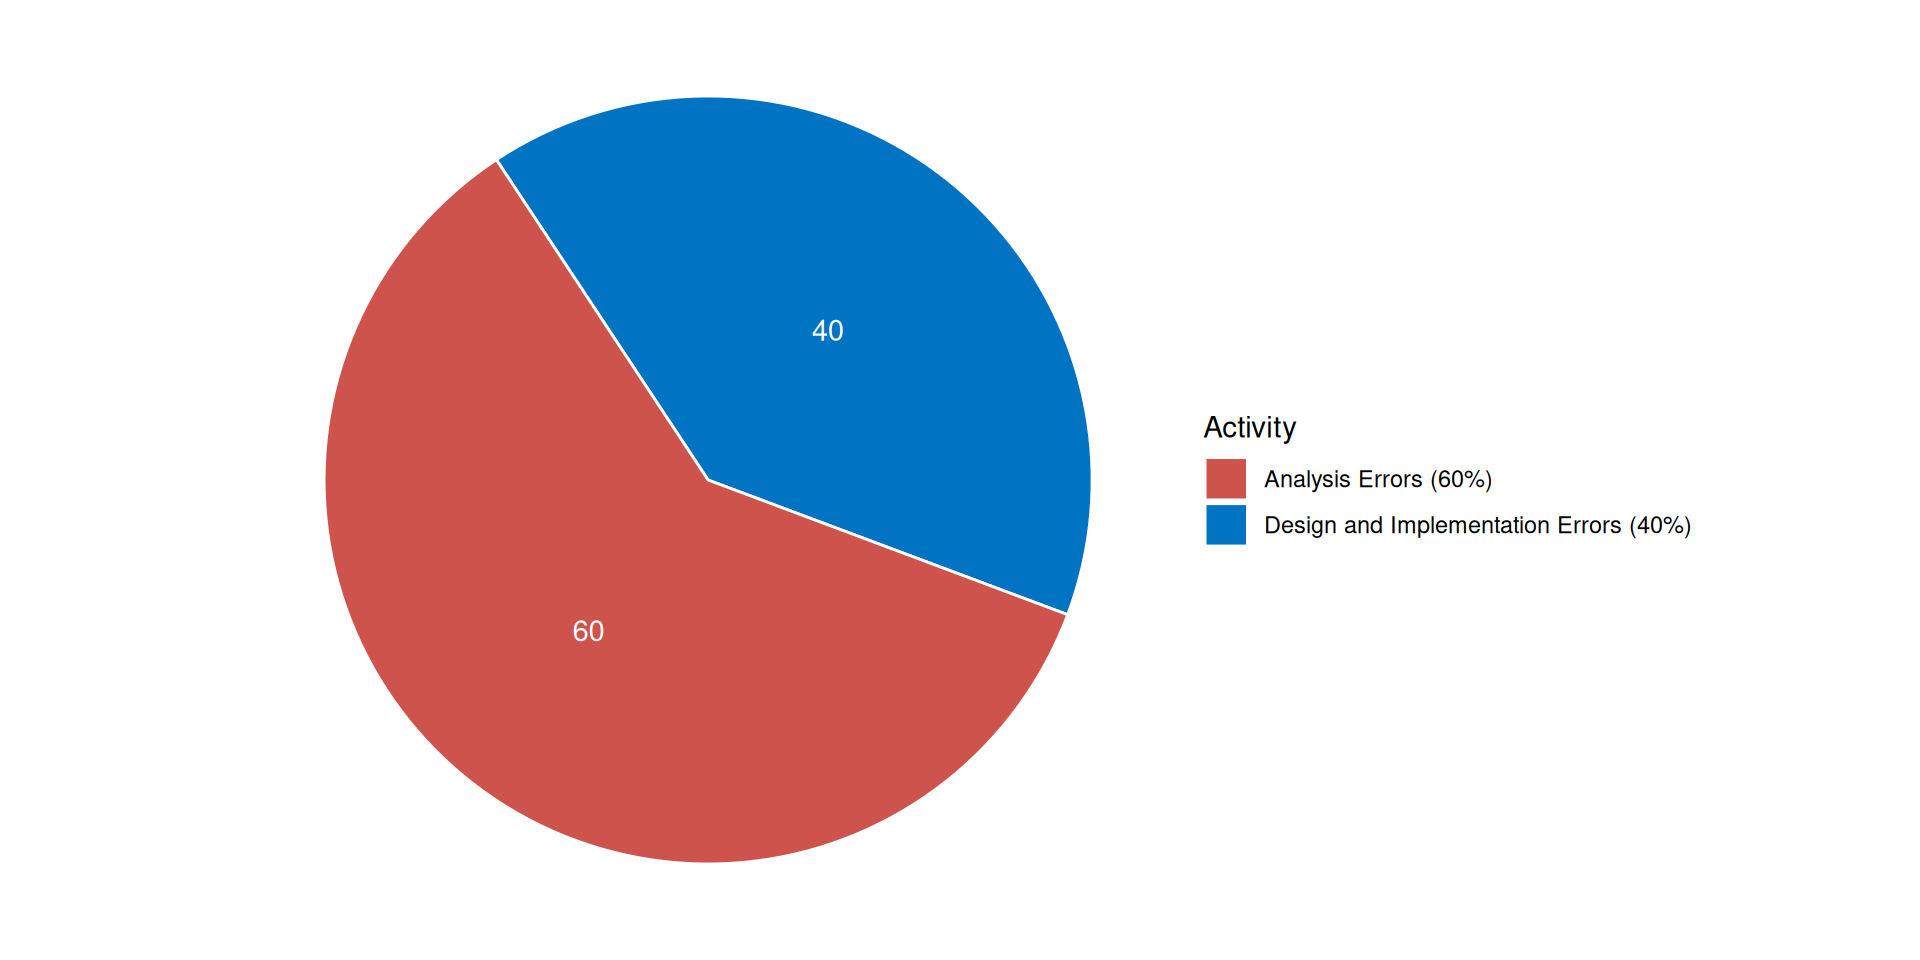
Boehm, B. (1981). Software Engineering Economics. Prentice Hall.
Why practice good engineering?
- Don’t waste time on maintenance
- Be faster with release on CRAN
- Don’t waste time with inefficient and buggy further development
- Fulfill regulatory requirements1
- Save refactoring time when the PoC becomes the release version
- You don’t have to be shy any longer about inviting other developers to contribute to the package on GitHub
Why practice good engineering?
Invest time in
- requirements analysis,
- software design, and
- architecture…
… but in many cases the workflow must be workable for a single developer or a small team.
Workable Workflow
Photo CC0 by Kateryna Babaieva on pexels.com
Suggestion for a Workable Workflow
- Idea
- Design docs
- R package programming
- Quality check (see Ensuring Quality by Wenyi)
- Use in production
Example - Step 1: Idea
Let’s assume that you used some lines of code to create simulated data in multiple projects:
Idea: put the code into a package
Example - Step 2: Design docs
- Describe the purpose and scope of the package
- Analyse and describe the requirements in clear and simple terms (“prose”)
| Obligation level | Key word1 | Description |
|---|---|---|
| Duty | shall | “must have” |
| Desire | should | “nice to have” |
| Intention | will | “optional” |
Example - Step 2: Design docs
Purpose and Scope
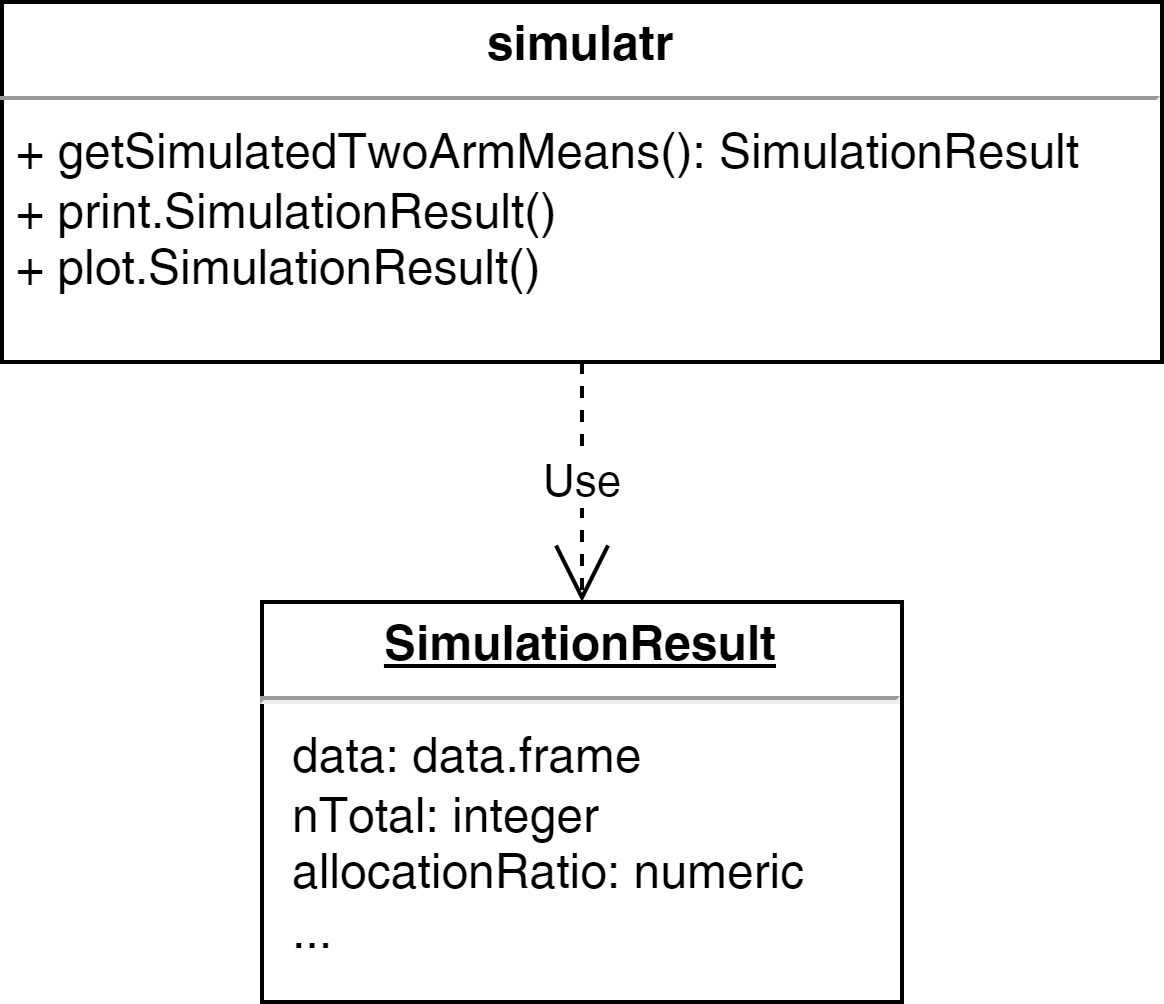
The R package simulatr shall enable the creation of reproducible fake data.
Package Requirements
simulatr shall provide a function to generate normal distributed random data for two independent groups. The function shall allow flexible definition of sample size per group, mean per group, standard deviation per group. The reproducibility of the simulated data shall be ensured via an optional seed It should be possible to print the function result. A graphical presentation of the simulated data will also be possible.
Example - Step 2: Design docs
Useful formats / tools for design docs:
- R Markdown1 (*.Rmd)
- Quarto1 (*.qmd)
- Overleaf2
- draw.io3
UML Diagram
Example - Step 3: Packaging
R package programming
- Create basic package project (see R Packages by Shuang)
- C&P existing R scripts (one-off scripts, prototype functions) and refactor1 it if necessary
- Create R generic functions
- Document all functions
Example - Step 3: Packaging
One-off script as starting point:
Example - Step 3: Packaging
Refactored script:
Almost all functions, arguments, and objects should be self-explanatory due to their names.
Example - Step 3: Packaging
Define that the result is a list1 which is defined as class2:
getSimulatedTwoArmMeans <- function(n1, n2, mean1, mean2, sd1, sd2) {
    result <- list(n1 = n1, n2 = n2,
         mean1 = mean1, mean2 = mean2, sd1 = sd1, sd2 = sd2)
    result$data <- data.frame(
        group = c(rep(1, n1), rep(2, n2)),
        values = c(
            rnorm(n = n1, mean = mean1, sd = sd1),
            rnorm(n = n2, mean = mean2, sd = sd2)
        )
    )
    # set the class attribute
    result <- structure(result, class = "SimulationResult")
    return(result)
}Example - Step 3: Packaging
The output is impractical, e.g., we need to scroll down:
$n1
[1] 50

$n2
[1] 50

$mean1
[1] 5

$mean2
[1] 7

$sd1
[1] 3

$sd2
[1] 4

$data
    group      values
1       1  2.78090210
2       1  1.02314942
3       1  4.36625882
4       1  5.45867316
5       1  3.54987542
6       1  5.67268228
7       1  0.23081130
8       1  4.58176561
9       1  3.28377297
10      1  2.26573121
11      1  9.32872172
12      1  5.04105978
13      1  5.78080239
14      1  5.15334794
15      1  2.40945218
16      1  8.90161070
17      1  4.43755987
18      1 10.06349942
19      1  2.71935016
20      1  5.01540767
21      1  9.05144980
22      1  8.72400629
23      1 10.78425009
24      1  6.34494008
25      1  6.26056420
26      1  6.23344151
27      1 -0.77439569
28      1  2.60389906
29      1  4.27414441
30      1  5.63345571
31      1  5.59985936
32      1  2.99648254
33      1  5.19802173
34      1  6.59166367
35      1  4.78700630
36      1  7.07533117
37      1  2.78691712
38      1  4.76741688
39      1  7.76722746
40      1 10.11304424
41      1  5.99722362
42      1  3.31352853
43      1  0.55685112
44      1  5.51554439
45      1  6.45768007
46      1  4.60498201
47      1  6.05565004
48      1  7.54306380
49      1  4.98728960
50      1  6.48515867
51      2  5.75071208
52      2 12.24894242
53      2  4.12940730
54      2  6.18000145
55      2  9.24523824
56      2  7.06143263
57      2  7.28336128
58      2 13.71756308
59      2  0.59763732
60      2  7.42131337
61      2  8.17720652
62      2  7.70309850
63      2 12.50708656
64      2  9.67078089
65      2 10.32718837
66      2  6.86300319
67      2  8.00829020
68      2 12.73176057
69      2  6.98397629
70      2  7.24850710
71      2  0.95372656
72      2 13.73631632
73      2  9.32963343
74      2  8.40416387
75      2  2.71190773
76      2  2.97853300
77      2  3.78012071
78      2 15.44614912
79      2 10.83691595
80      2  2.31939012
81      2  7.23568860
82      2  6.56745510
83      2  1.44132770
84      2  8.22715287
85      2  1.96970033
86      2 10.41537106
87      2 -0.02374985
88      2 12.90533727
89      2  9.65089646
90      2  2.51479214
91      2  2.88153678
92      2  8.81130372
93      2  6.73969230
94      2  6.94742002
95      2 10.16976803
96      2  7.51688181
97      2  2.84933029
98      2  2.35291343
99      2  3.09653516
100     2  1.89549771

attr(,"class")
[1] "SimulationResult"
Solution: implement generic function print
Example - Step 3: Packaging
Generic function print:
#' @title
#' Print Simulation Result
#'
#' @description
#' Generic function to print a `SimulationResult` object.
#'
#' @param x a \code{SimulationResult} object to print.
#' @param ... further arguments passed to or from other methods.
#'
#' @examples
#' x <- getSimulatedTwoArmMeans(n1 = 50, n2 = 50, mean1 = 5,
#'      mean2 = 7, sd1 = 3, sd2 = 4, seed = 123)
#' print(x)
#'
#' @export
$args
n1 n2 mean1 mean2 sd1 sd2
"50" "50" "5" "7" "3" "4"
$data
# A tibble: 100 × 2
group values
<dbl> <dbl>
1 1 2.78
2 1 1.02
3 1 4.37
4 1 5.46
5 1 3.55
6 1 5.67
7 1 0.231
8 1 4.58
9 1 3.28
10 1 2.27
# ℹ 90 more rowsWebsite with pkgdown
Setup of pkgdown
pkgdownmakes it quick and easy to build a website for your package- After installing
pkgdown, just useusethis::use_pkgdown()to get started - Main configuration happens in
_pkgdown.ymlfile - Many customizations can be applied, but main work during development is to keep the
referencesection updated with names of.Rdfiles
Example _pkgdown.yml file
---
url: https://openpharma.github.io/mmrm

template:
  bootstrap: 5
  params:
    ganalytics: UA-125641273-1

navbar:
  right:
    - icon: fa-github
      href: https://github.com/openpharma/mmrm

reference:
  - title: Package
    contents:
      - mmrm-package
  - title: Functions
    contents:
      - mmrm
      - fit_mmrm
      - mmrm_control
      - fit_single_optimizer
      - refit_multiple_optimizers
      - df_1d
      - df_md
      - component
Publication as GitHub Page
- It is helpful for users to read the website online
- GitHub is very helpful here because it allows
- A separate branch
gh-pagesthat stores the rendered website - GitHub actions automatically render the website when the
mainbranch is updated
- A separate branch
- To get started, use
usethis::use_pkgdown_github_pages()- Or, manually deploy site with
pkgdown::deploy_to_branch()
- Or, manually deploy site with
Exercise
Photo CC0 by Pixabay on pexels.com
Preparation
- Download the unfinished R package simulatr
- Extract the package zip file
- Open the project with RStudio
- Complete the tasks below
Tasks
Add assertions to improve the usability and user experience
Tip on assertions
Use the package checkmate to validate input arguments.
Example:
Error in playWithAssertions(-1) : Assertion on ‘n1’ failed: Element 1 is not >= 1.
Add three additional results:
- n total,
- creation time, and
- allocation ratio
Tip on creation time
Sys.time(), format(Sys.time(), '%B %d, %Y'), Sys.Date()
Add an additional result: t.test result
Add an optional alternative argument and pass it through t.test:
Implement the generic functions print and plot.
Tip on print
Use the plot example function from above and extend it.
Optional extra tasks:
Implement the generic functions
summaryandcatImplement the function
kableknown from the package knitr as generic. Tip: useto define kable as generic
Optional extra task1:
Document your functions with Roxygen2
- If you are already familiar with Roxygen2
References
- Gillespie, C., & Lovelace, R. (2017). Efficient R Programming: A Practical Guide to Smarter Programming. O’Reilly UK Ltd. [Book | Online]
- Grolemund, G. (2014). Hands-On Programming with R: Write Your Own Functions and Simulations (1. Aufl.).
O’Reilly and Associates. [Book | Online] - Rupp, C., & SOPHISTen, die. (2009). Requirements-Engineering und -Management: Professionelle, iterative Anforderungsanalyse für die Praxis (5. Ed.). Carl Hanser Verlag GmbH & Co. KG. [Book]
- Wickham, H. (2015). R Packages: Organize, Test, Document, and Share Your Code (1. Aufl.). O’Reilly and Associates. [Book | Online]
- Wickham, H. (2019). Advanced R, Second Edition.
Taylor & Francis Ltd. [Book | Online]
License information
- Creators (initial authors): Friedrich Pahlke
- In the current version, changes were done by (later authors): Joe Zhu
- This work is licensed under the Creative Commons Attribution-ShareAlike 4.0 International License.
- The source files are hosted at github.com/pharmarug/pharmasug2026-r-workshop, which is forked from the original version at github.com/openpharma/workshop-r-swe.
- Important: To use this work you must provide the name of the creators (initial authors), a link to the material, a link to the license, and indicate if changes were made